Key Takeaways
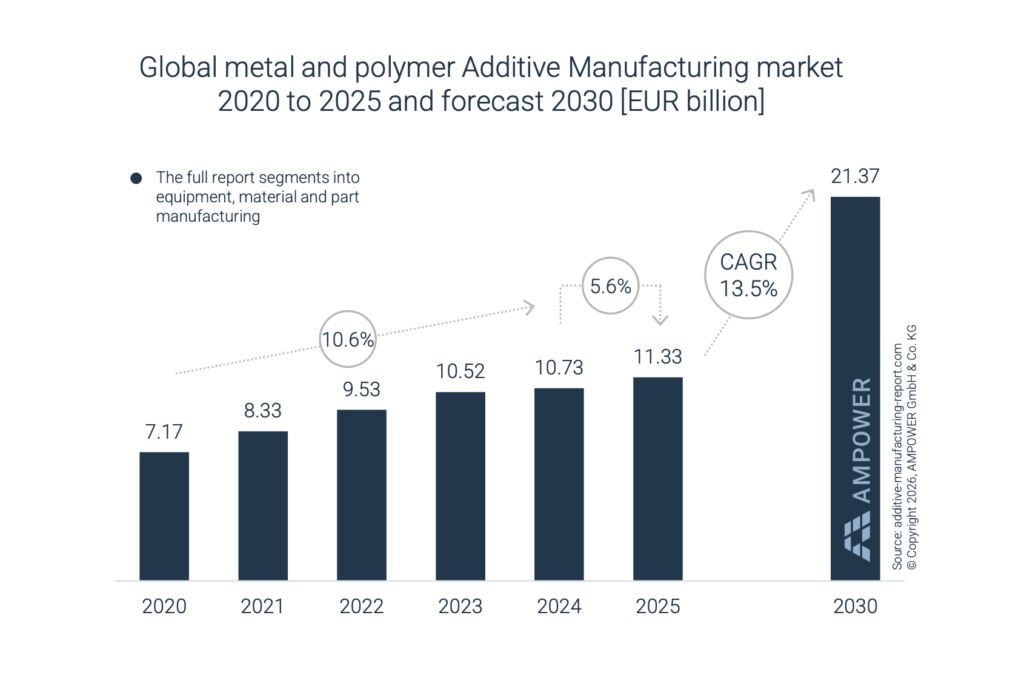
- The industrial 3‑D printing market is projected to grow 10‑15 % CAGR through 2030, driven by aerospace, defence, automotive and healthcare demand.
- Unit cost per part has fallen 30‑45 % since 2022 thanks to patent expirations, larger build volumes and more mature workflows.
- Trust‑building—delivering on quoted lead times, tolerances and surface finish—is now the decisive factor for winning market share.
- Additive manufacturing (AM) will not replace injection moulding, but it will secure a complementary niche for low‑to‑mid‑volume, high‑complexity production.
Additive Manufacturing’s Next Growth Wave: Trust as the Deciding Factor
Why 2025 Marks a Turning Point
After a stagnant 2024, the global industrial 3‑D printing sector re‑ignited growth in 2025 (source: Additive Manufacturing Report 2025). Forecasts show a compound annual growth rate (CAGR) of 10‑15 % through 2030, largely fueled by:
| Sector | Projected 2025‑2030 Spend (USD bn) | Primary Drivers |
|---|---|---|
| Aerospace & Defence | 4.2 | Weight‑critical, low‑volume parts |
| Automotive | 3.1 | Customized tooling, lightweight brackets |
| Healthcare | 2.5 | Patient‑specific implants, surgical guides |
| General Manufacturing | 1.8 | Spare‑part on‑demand, redesign cycles |
The surge stems from three converging trends:
- Patent expirations on key metal‑laser technologies (e.g., DMLS, SLM) have opened the market to new entrants, driving equipment prices down 20‑30 % since 2022.
- Capacity expansion—global printer fleet grew from 12 k units in 2022 to ≈18 k units in 2025, adding roughly 150 k m³ of build volume.
- Maturing supply chains—standardised post‑processing (heat‑treatment, support removal) now achieve repeatable surface roughness of Ra ≤ 3 µm, meeting aerospace specifications without costly re‑work.
The Experience Curve in Action
The classic “experience curve” predicts that each doubling of cumulative output reduces unit cost by 15‑25 %. In AM, the curve is evident:
- Cost per part for a typical Ti‑6Al‑4V aerospace bracket fell from $180 in 2022 to $95 in 2025 (≈ 47 % reduction).
- Lead time for a 50 mm × 50 mm × 30 mm component dropped from 12 weeks (2022) to 6 weeks (2025) as build‑plate utilization rose from 55 % to 78 %.
These gains hinge on consistent delivery. Customers who receive parts on schedule, within tolerance, and with documented material properties are the ones who stay loyal.
Trust as the Competitive Moat
Over the past decade, many AM service bureaus over‑promised on part density, mechanical performance, or delivery dates, eroding confidence. The next growth phase will reward firms that:
| Trust Metric | Desired Performance | Industry Benchmark |
|---|---|---|
| On‑time delivery | ≥ 95 % of orders within quoted window | ≤ 5 % deviation |
| Dimensional accuracy | ± 0.05 mm for < 100 mm features | ISO 286‑1 compliance |
| Material certification | Full traceability to ASTM/ISO standards | 100 % traceable batches |
| Post‑process repeatability | Surface roughness Ra ≤ 3 µm (as‑built) | 90 % of parts meet spec |
Companies that embed real‑time monitoring, digital twins of the build process, and transparent reporting dashboards are already seeing repeat‑order rates climb to 78 %, compared with an industry average of 52 %.
Additive Manufacturing vs. Conventional Methods
| Attribute | Additive Manufacturing (Metal) | Injection Moulding | CNC Turning | Extrusion |
|---|---|---|---|---|
| Typical Volume | 10‑10 000 pcs | > 10 000 pcs | 100‑5 000 pcs | 5 000‑100 000 pcs |
| Unit Cost (USD) | $90‑$250 (mid‑complex) | $0.30‑$2 (high‑volume) | $15‑$45 (medium) | $2‑$8 |
| Lead Time | 4‑8 weeks (incl. post‑process) | 2‑4 weeks (tooling) | 1‑3 weeks | 1‑2 weeks |
| Design Flexibility | Unlimited internal geometry | Limited to draft angles | Limited by tool access | Limited to cross‑section |
| Material Palette | > 80 alloys & polymers | ~30 polymers & metals | ~15 alloys | ~10 polymers |
Source: Internal market analysis, 2025.
What Companies Must Do Now
- Standardise Quality Protocols – Adopt ISO/ASTM‑specific AM standards (e.g., ISO/ASTM 52900) across the entire workflow.
- Invest in Predictive Analytics – Use machine‑learning models to forecast build failures, cutting scrap rates from 8 % to < 2 %.
- Communicate Transparently – Provide customers with real‑time build status, material certificates, and post‑process reports.
- Scale Responsibly – Align capacity expansion with demand forecasts to avoid under‑utilisation, which can re‑inflate per‑part costs.
Bottom Line
Additive manufacturing is poised for a sustained 10‑15 % CAGR through 2030, anchored by aerospace, defence, automotive and healthcare demand. While cost reductions and faster lead times open new application windows, the decisive advantage will belong to firms that honour their promises—delivering on schedule, within spec, and with full material traceability. Trust, not just technology, will be the currency that determines who captures


