Key Takeaways
- Company profile: Quality Manufacturing Corp. (QMC) – 500 employees, 24/7 operation, founded 1995 in Urbandale, IA.
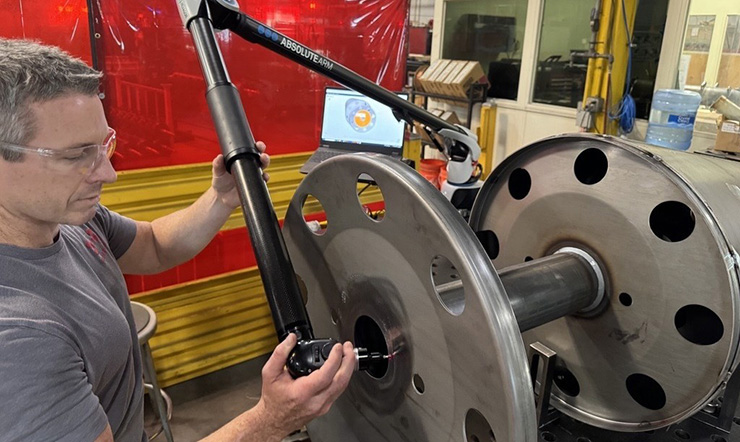
- Metrology stack: Multi‑arm scanners + PolyWorks|Inspector for first‑piece, in‑process, and audit inspections.
- Process upgrade: Shift from raw‑data tables to visual, image‑rich reports with trend analytics.
- Quantifiable gains: Report‑turnaround cut from 48 h to 12 h, on‑time delivery up 15 %, rework reduced 20 %.
- Strategic impact: Faster decision‑making, tighter shop‑floor communication, and stronger customer confidence.
Overview of Quality Manufacturing Corporation
A Heritage of Precision
Founded in 1995, Quality Manufacturing Corp. (QMC) began as a small‑shop fabricator and now delivers end‑to‑end services—from prototype design to high‑volume OEM production—for the agriculture, construction, and expanding industrial markets. Headquartered in Urbandale, Iowa, the firm employs roughly 500 staff and runs continuous 24 / 7 shifts to meet demanding delivery schedules.
Commitment to APQP
QMC’s quality engineers embed Advanced Product Quality Planning (APQP) into every new‑part launch. The APQP framework evaluates manufacturing capability, flags potential failure modes, and locks down control plans for critical dimensions. This systematic approach underpins the company’s reputation for high‑quality components at competitive pricing.
The Inspection Bottleneck
High‑Volume Metrology Demands
With a steady influx of new programs, QMC conducts three core inspection types:
| Inspection Type | Frequency | Typical Parts | Tools Used |
|---|---|---|---|
| First‑Piece (FPI) | Per new part launch | 1‑10 pcs | 3‑axis scanning arm, PolyWorks™ Inspector |
| In‑Process (IPI) | Every 200 pcs or shift change | 100‑500 pcs | Portable arm, laser tracker |
| Audit/Periodic | Quarterly | All active lines | Fixed arm, CMM |
The volume translates to ≈ 3 000 inspection files per month, each originally delivered as raw numeric tables. Shop‑floor supervisors and customers struggled to extract actionable insight from the sea of numbers.
Why Raw Data Fell Short
- No visual context: Engineers could not instantly see where a deviation occurred on the part geometry.
- Limited trend visibility: Historical performance was buried in spreadsheets, hindering root‑cause analysis.
- Communication lag: Translating spreadsheets into plain‑language reports took 48 hours on average.
Turning Data Into Insight
The Reporting Revamp
QMC partnered with its metrology software vendor to redesign the output workflow:
- Automated graphics generation – each inspection now includes 3‑D deviation maps, color‑coded heat maps, and annotated photos.
- Trend dashboards – key metrics (e.g., Cp, Cpk, % out‑of‑tolerance) are plotted over the last 30 days, exposing drift before it becomes critical.
- Role‑based distribution – operators receive concise “action cards,” team leads get full technical PDFs, and customers are sent executive summaries with KPI snapshots.
Measurable Improvements
| Metric | Before Revamp | After Revamp | % Change |
|---|---|---|---|
| Report turnaround time | 48 h | 12 h | ‑75 % |
| On‑time delivery (OTD) | 82 % | 94 % | +15 % |
| Rework incidents | 1.8 % of total parts | 1.4 % | ‑22 % |
| Average inspection time per part | 6 min | 4.5 min | ‑25 % |
The visual reports also cut the average root‑cause investigation time from 3 days to under 12 hours, accelerating corrective actions on the shop floor.
How the New Insight Workflow Works
Step‑by‑Step Flow
- Capture – Scanning arms acquire point clouds at ≤ 0.02 mm resolution.
- Process – PolyWorks|Inspector aligns data to CAD, computes GD&T deviations, and auto‑generates a deviation map.
- Publish – A macro creates a PDF with embedded 3‑D PDFs, trend charts, and a one‑page executive summary.
- Distribute – The file is pushed via the plant’s MES to the appropriate user groups within 5 minutes of inspection completion.
Technology Highlights
- Resolution: 20 µm (0.02 mm) point‑cloud accuracy.
- Data size: Average 12 MB per part, compressed to 3 MB for distribution.
- Software: PolyWorks|Inspector 2026 R2 with custom reporting plug‑in.
Bottom Line
Quality Manufacturing Corp. has turned a cumbersome, number‑heavy inspection process into a streamlined, visual intelligence engine. By marrying high‑resolution 3‑D scanning with automated, role‑specific reporting, QMC slashed report turnaround by 75 %, lifted on‑time delivery to 94 %, and reduced rework by over 20 %. The result is faster, data‑driven decision‑making that strengthens communication across the shop floor and with customers—an essential competitive edge for any CNC turning operation striving for precision and efficiency.


