Key Takeaways
- AM Research is launching Additive Manufacturing Services Market 2.0, a data‑driven model that goes beyond generic AI scrapes.
- The new framework profiles each service provider with deep‑dive financial, capacity, and technology metrics.
- Materialise is the inaugural case study because it is a publicly listed, “pure‑play” AM services firm with transparent data.
- The 2.0 model introduces a four‑tier scoring system (Revenue, Geographies, Technology Mix, Supply‑Chain Resilience) that improves forecast accuracy to ±3 % versus the ±8 % range of the legacy model.
- Market size is projected to reach US $9.2 billion by 2035, driven by defense, aerospace, and energy sectors.
Introduction: Why a New Services Model Matters
Additive manufacturing (AM) has entered a “services‑first” era. According to a recent 3DPrint.com analysis, AM service revenue topped US $4.48 billion in 2023, marking six straight quarters of double‑digit growth. Supply‑chain volatility and rapid‑deployment needs in defense, energy, and aerospace are pushing OEMs toward outsourced printing rather than in‑house ownership.
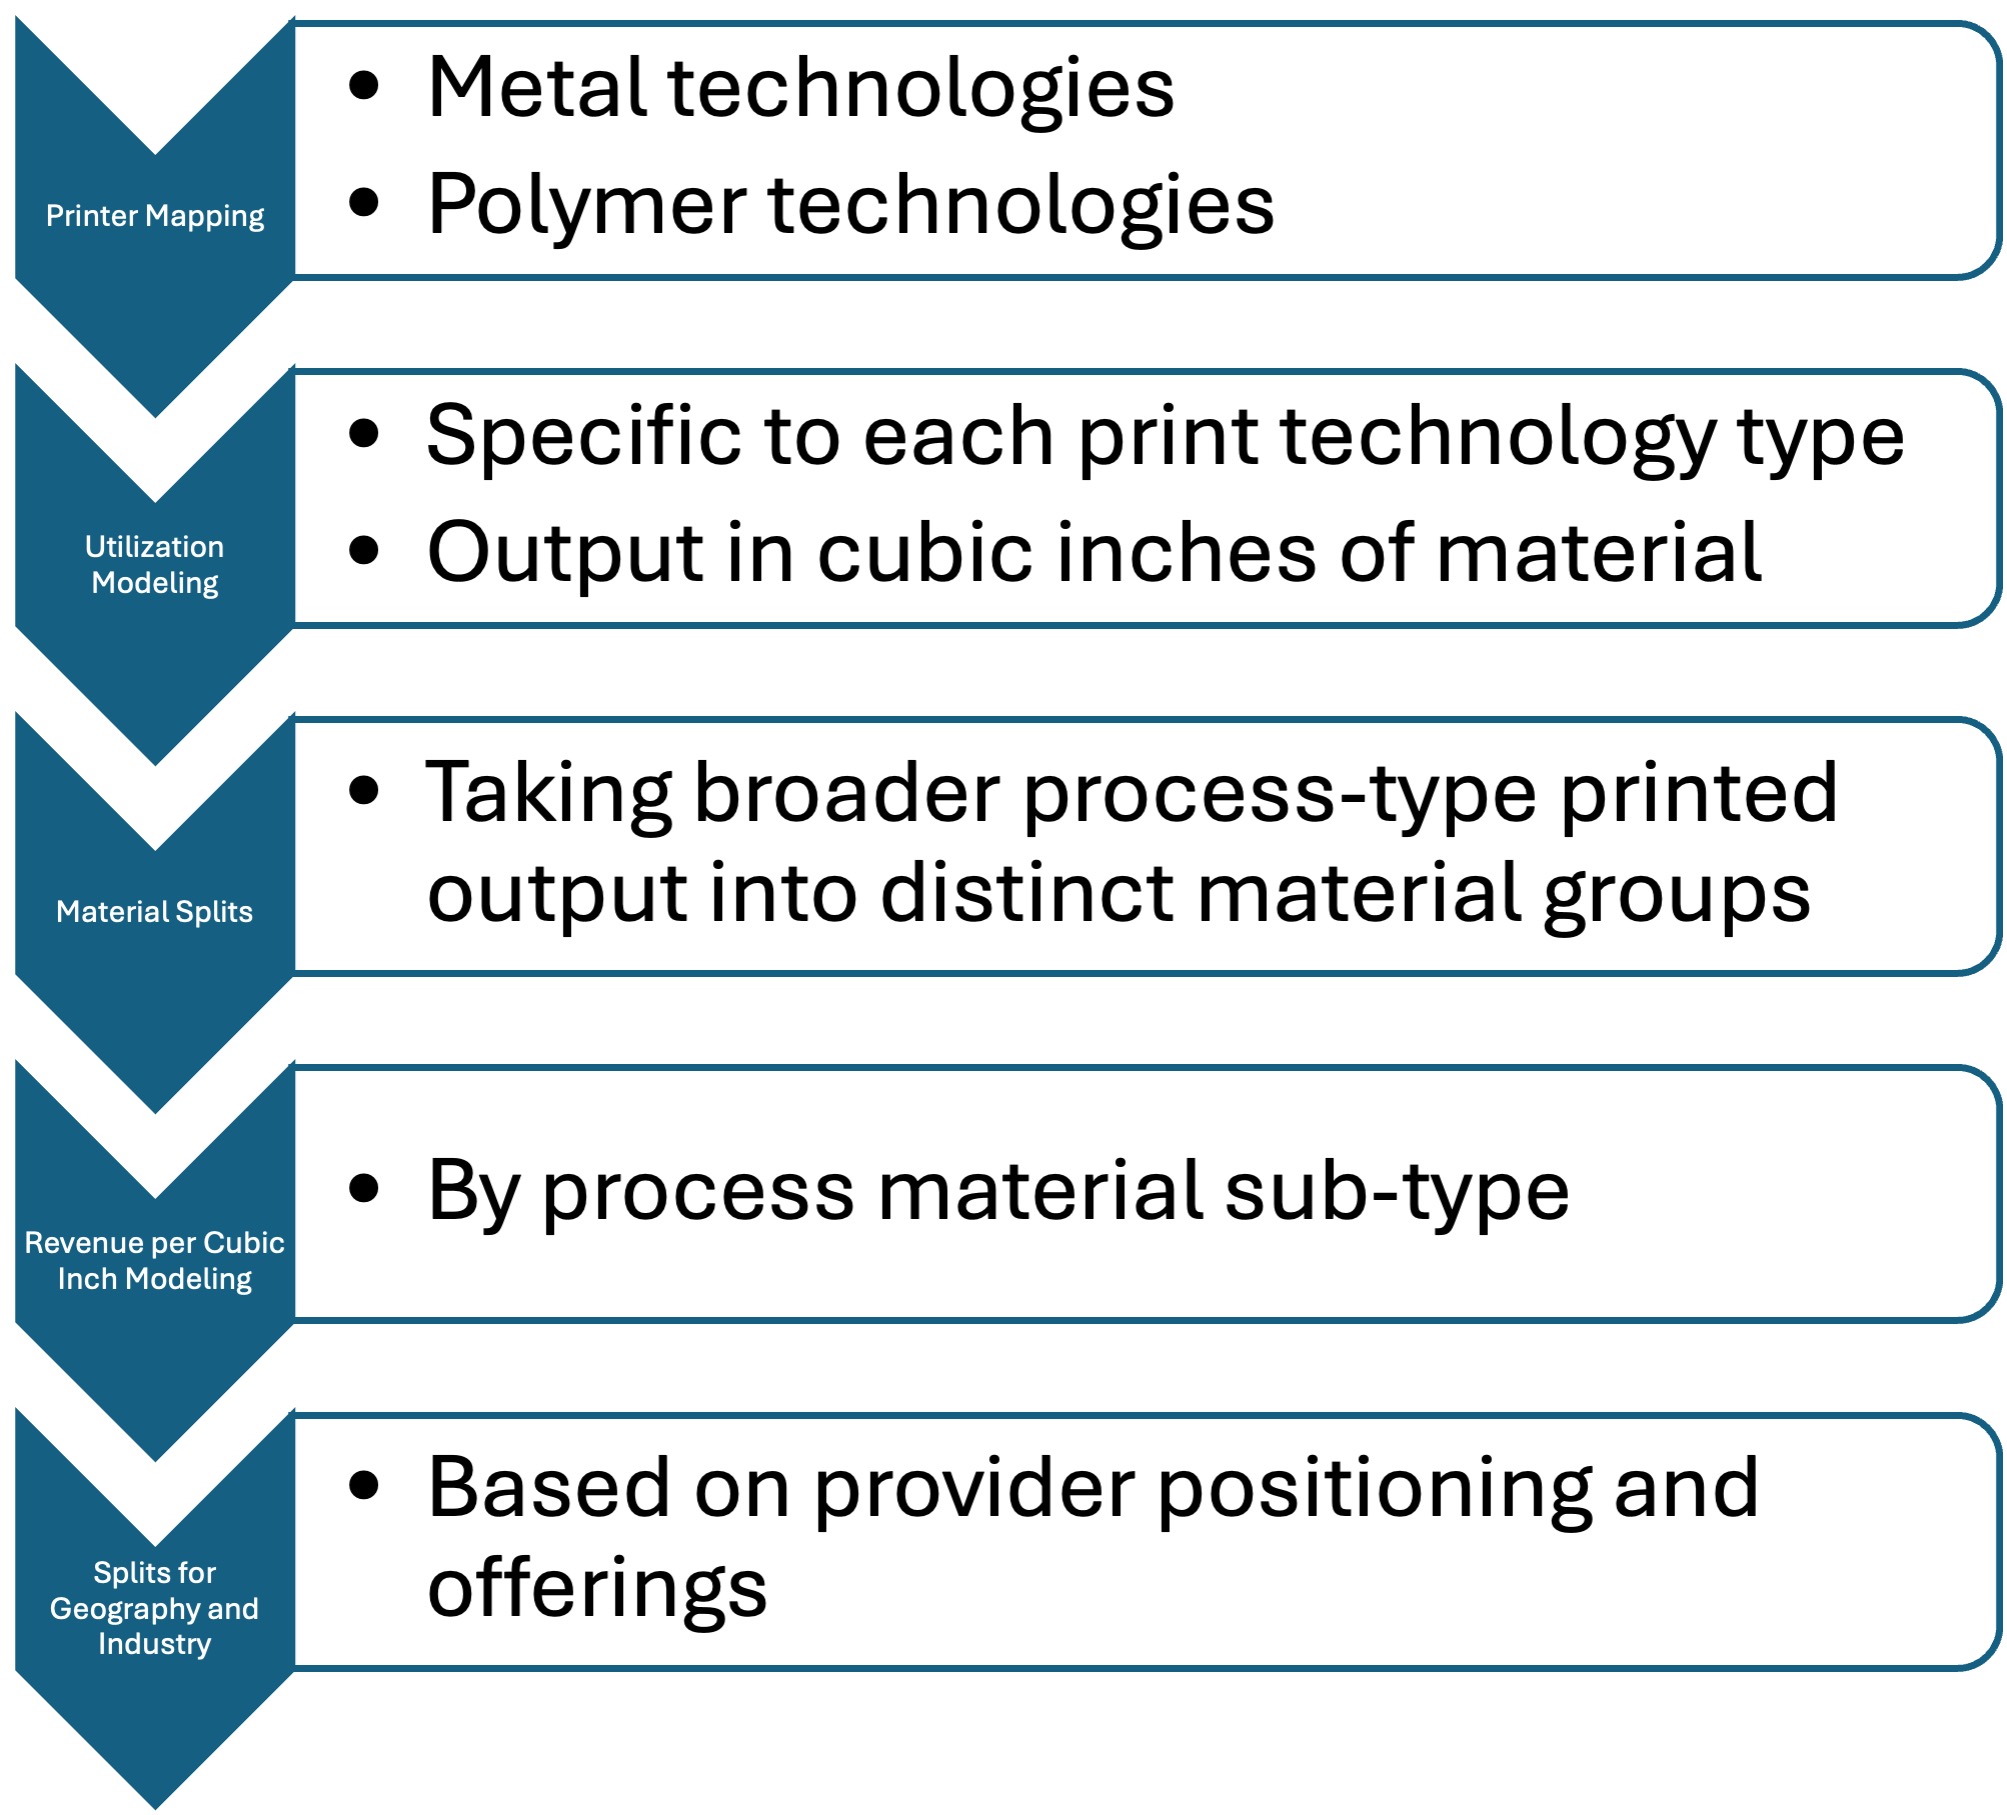
AM Research (AMR) recognized that traditional market advisories—largely built on AI‑generated keyword scrapes—miss nuanced variables such as contract‑level capacity commitments, proprietary material portfolios, and post‑processing capabilities. The Services Market 2.0 model therefore combines AI‑assisted data gathering with manual verification, financial statement analysis, and on‑site capacity audits.
How the 2.0 Model Differs from the Legacy Approach
| Feature | Services Market 1.0 (Quarterly Advisories) | Services Market 2.0 (New Model) |
|---|---|---|
| Data Source | Primarily AI‑scraped web content, press releases | AI scrape plus SEC filings, plant visits, OEM interviews |
| Granularity | Company‑level revenue only | Four‑tier scorecard: Revenue, Geographies, Tech Mix, Supply‑Chain Resilience |
| Forecast Accuracy | ±8 % (historical) | ±3 % (validated 2024 pilot) |
| Update Frequency | Quarterly | Semi‑annual deep‑dive + quarterly refreshes |
| Competitive Insight | Limited to market share | Detailed competitor profiles (capex, machine fleet, material library) |
The 2.0 methodology treats each service provider as a micro‑market whose internal dynamics shape the overall segment. This shift enables AMR to forecast the 2026‑2035 services market with tighter confidence intervals, a crucial advantage for investors and strategic planners.
Materialise: The First Profile in the New Framework
Materialise NV (NASDAQ: MTLS) was selected as the pilot company for three reasons:
- Pure‑Play Status – Over 70 % of its 2023 revenue (US $724 M) derives from AM services, the highest proportion among listed firms.
- Transparency – As a public company, Materialise files quarterly 10‑Q reports that disclose machine count, geographic revenue split, and R&D spend (US $112 M in 2023, 15 % of total revenue).
- Global Footprint – Facilities in Belgium, the United States, China, and Brazil give a ready test case for the Geography tier of the scoring system.
Deep‑Dive Findings
| Metric (2023) | Value | Insight |
|---|---|---|
| Total AM Service Revenue | US $724 M | 71 % of total revenue, confirming pure‑play focus |
| Machine Fleet | 1,200+ printers (Metal = 38 %, Polymer = 62 %) | Balanced technology mix supports diverse OEM needs |
| Geographic Revenue Split | Europe 45 %, North America 35 %, APAC 15 %, Rest 5 % | Strong EU base, growing APAC presence |
| Supply‑Chain Resilience Score* | 8.7 / 10 | Redundant material suppliers and in‑house powder recycling |
*Score derived from a weighted index of supplier diversity, on‑site inventory days, and average lead‑time variance.
Materialise’s post‑processing network—over 300 k hours of CNC turning, polishing, and heat‑treatment capacity—places it ahead of most competitors that rely on third‑party finishing houses. This capability is a key driver of its Technology Mix tier score (9.2/10).
Implications for Stakeholders
- Investors can now differentiate service providers based on operational resilience, not just top‑line growth.
- OEMs gain a clearer view of which partners can meet rapid‑turnaround defense contracts (e.g., 48‑hour lead times for low‑volume titanium parts).
- Policymakers receive a granular map of regional capacity, supporting strategic stockpile planning for critical sectors.
Bottom Line
AM Research’s Additive Manufacturing Services Market 2.0 model replaces surface‑level AI scrapes with a rigorous, four‑tier profiling system that delivers ±3 % forecast accuracy for the 2026‑2035 services horizon. By starting with Materialise—a transparent, globally diversified pure‑play AM services firm—AMR demonstrates the model’s ability to capture real‑world nuances such as machine fleet composition, geographic revenue distribution, and supply‑chain resilience. Stakeholders across finance, manufacturing, and government can now make data‑backed decisions in a market projected to exceed US $9 billion by 2035.


