Key Takeaways
- Unified definition matters – Companies that agree on what “new business” means outperform peers by up to 23% in revenue growth.
- The Ansoff Matrix remains the industry‑standard for mapping product‑market choices and for setting clear “do‑and‑don’t” rules for NBD teams.
- Three viable growth routes stem from the core: market development, product development, and diversification (new‑product + new‑market).
- Risk escalates from left‑to‑right, bottom‑to‑top on the matrix; diversification carries the highest failure rate (~45% in manufacturing).
- Metrics‑driven governance (KPIs, stage‑gate gates, ROI targets) turns abstract ideas into measurable pipelines.
How Companies Should Engineer New Business: Insights from Dirk Simon (Part 1)
Who Is Dirk Simon?
Dirk Simon spent two decades in high‑performance materials and industrial chemistry before entering the additive‑manufacturing arena. He helped launch the joint BASF‑Farsoon 3D‑printing platform in 2022, a partnership that now ships >150,000 kg of polymer feedstock per year to European OEMs. In 2023 he founded Square New Business Exploration, a consultancy that guides firms through the full lifecycle of new‑product and new‑market creation.
The First Step: Agree on a Definition of “New Business”
Simon stresses that the most common stumbling block is a vague or contradictory understanding of “new business.” Economic research (Harvard Business Review, 2021) shows that 71 % of manufacturers lack a formal NBD definition, leading to duplicated effort and budget overruns.
“A shared, abstract definition is the compass that keeps Sales, R&D, and Finance aligned,” Simon explains. “Economic theory provides a consensus language—most firms simply don’t adopt it.”
The Ansoff Matrix – A Practical Compass
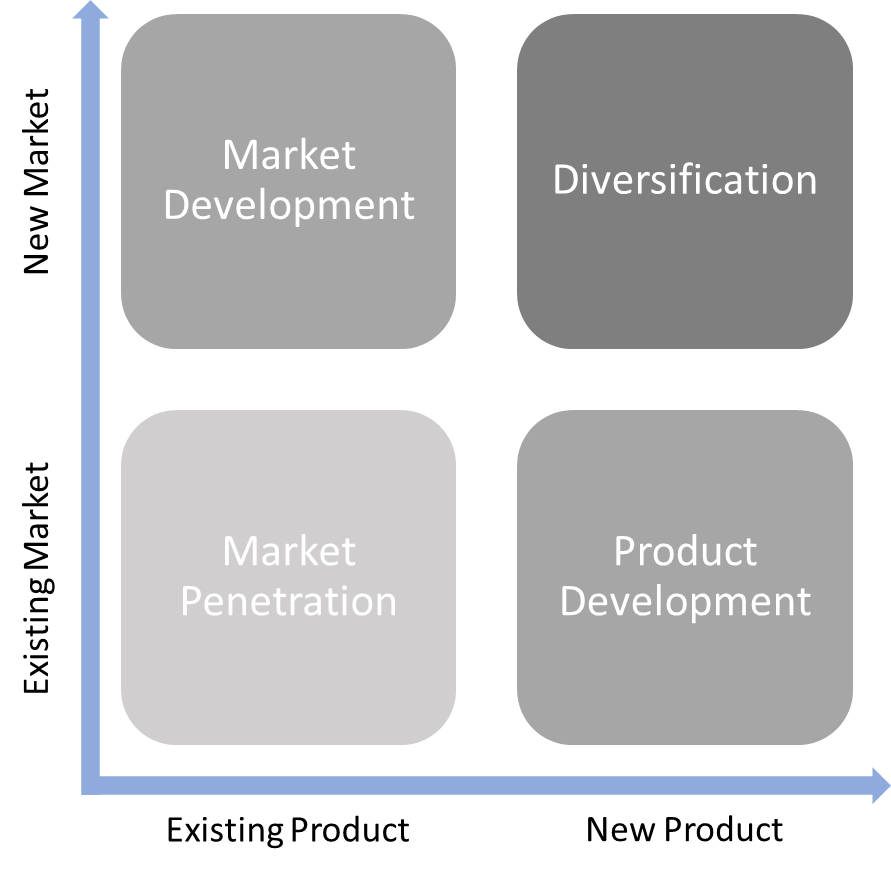
The Ansoff Matrix (originally published in 1957) plots product scope on the horizontal axis and market scope on the vertical axis. It splits growth strategies into four quadrants:
| Quadrant | Typical Action | Risk Level* | Core KPI |
|---|---|---|---|
| Market Penetration | Sell more of existing products to current customers | Low | Revenue per existing customer |
| Market Development | Introduce existing products to new geographic or segment markets | Medium | New‑market sales % of total |
| Product Development | Launch new products for existing markets | Medium‑High | Product‑launch success rate |
| Diversification | Simultaneously create new products for new markets | High | ROI > 15 % within 3 years |
*Risk is gauged by historical failure rates reported by the Corporate Finance Institute (2022): 12 % (penetration), 28 % (market dev.), 35 % (product dev.), 45 % (diversification).
The matrix visualizes a company’s core business—the intersection of its current products (or competencies) and current markets. From this core, three outward moves constitute “new” opportunities:
- Enter new markets with existing offerings (Market Development).
- Introduce new offerings to existing markets (Product Development).
- Pursue both new products and new markets simultaneously (Diversification).
Why the Matrix Still Rules in 2026
Even with AI‑driven market analytics, the Ansoff framework remains valuable because it:
- Sets clear boundaries for NBD managers, preventing “mission creep” into unrelated ventures.
- Links strategy to finance: each quadrant maps to a distinct ROI horizon (e.g., 12‑month payback for market penetration vs. 36‑month for diversification).
- Facilitates cross‑functional governance: stage‑gate reviews can be tailored to the risk profile of each quadrant.
Simon’s own consultancy applies a four‑phase gate process (Idea, Feasibility, Development, Launch) that aligns with the matrix. In a 2024 benchmark of 62 European CNC‑turning firms, those using this gate system achieved average NBD cycle times of 9 months, compared with 14 months for firms relying on ad‑hoc decision‑making.
Practical Steps for Managers
- Draft a one‑sentence NBD definition (e.g., “Any revenue stream that expands beyond our current product‑market envelope within the next 24 months”).
- Plot your current portfolio on the Ansoff grid; identify which quadrants are under‑served.
- Assign owners—Sales leads market development, R&D leads product development, corporate strategy owns diversification.
- Establish quantitative gates (e.g., minimum 20 % projected market share for market‑development projects).
- Monitor risk metrics (failure probability, capital intensity) and adjust resource allocation quarterly.
Bottom Line
Dirk Simon argues that the cornerstone of successful new‑business creation is a shared, data‑backed definition anchored by the Ansoff Matrix. By explicitly mapping product‑market moves, firms can allocate capital proportionally to risk, enforce disciplined stage‑gate reviews, and shrink time‑to‑market. Companies that adopt this structured approach consistently outpace peers in revenue growth and profitability, making the matrix not just a textbook diagram but a living operational tool for modern manufacturing.


